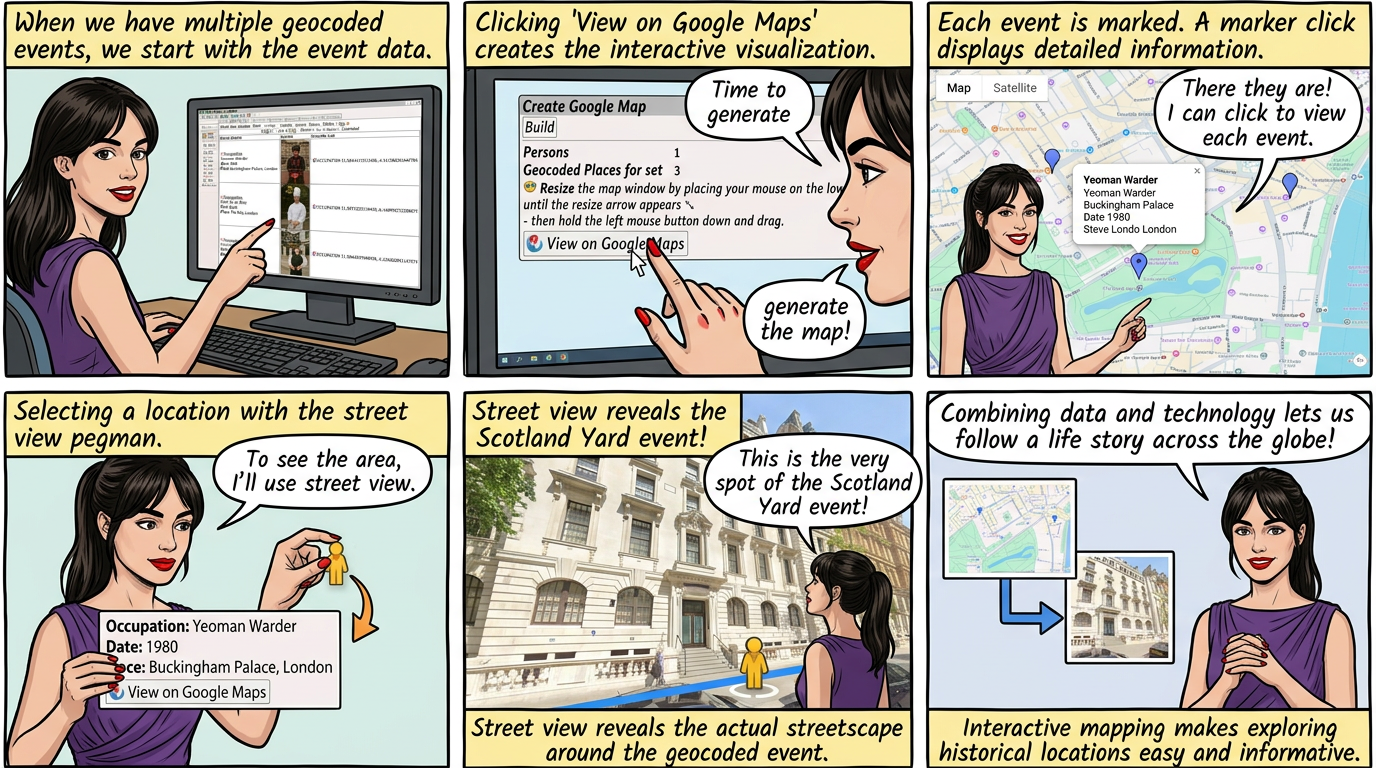
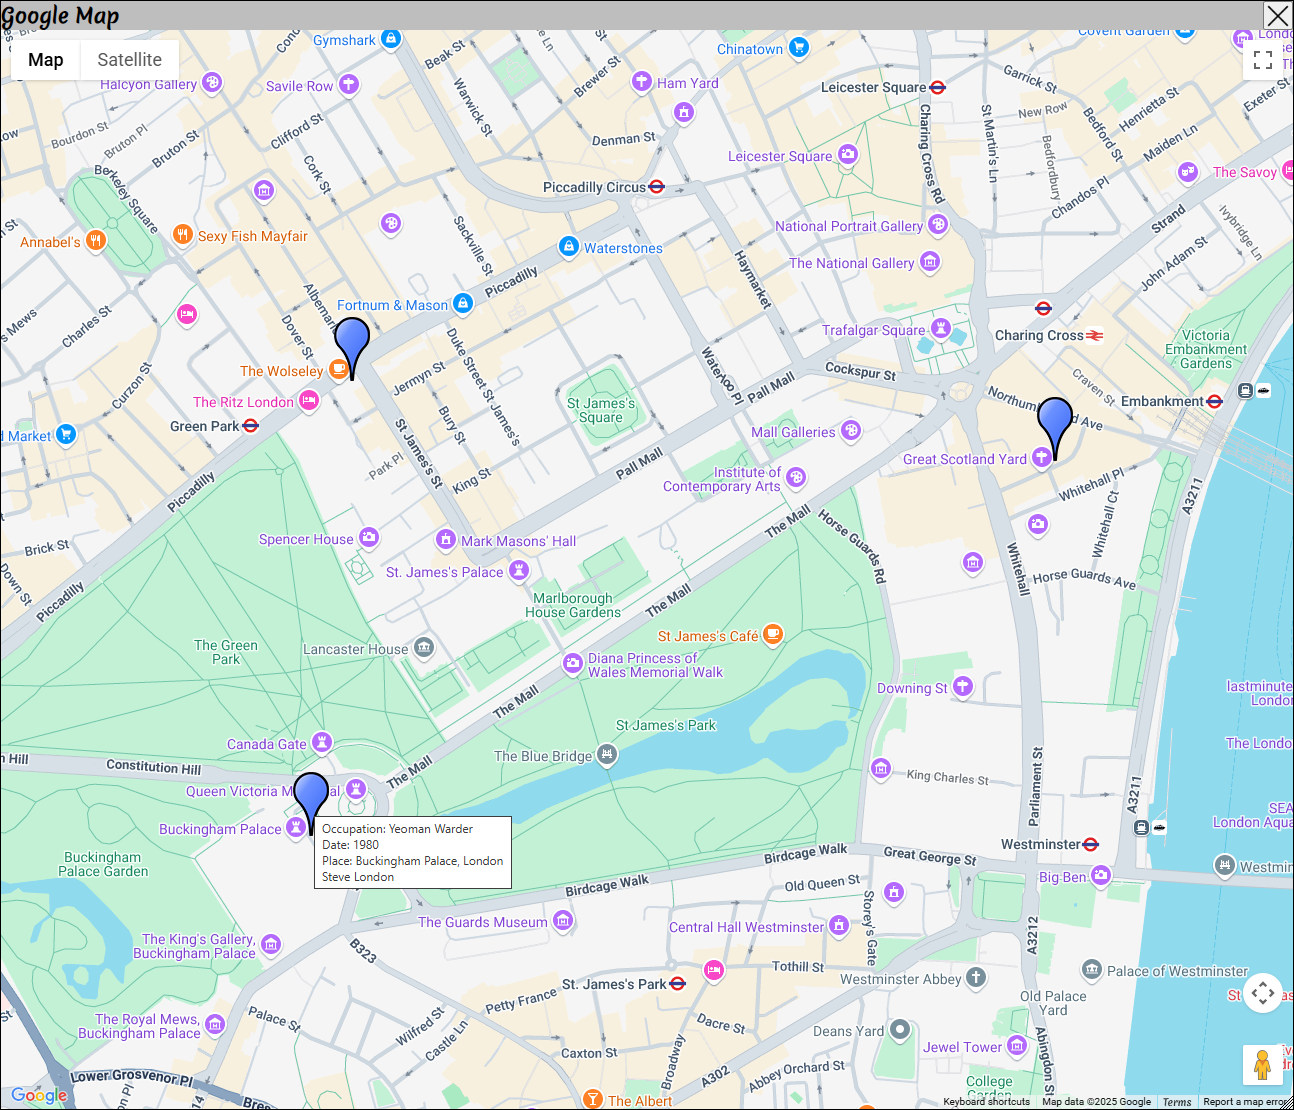
When we have multiple geo-coded events, we can plot them on an interactive map.
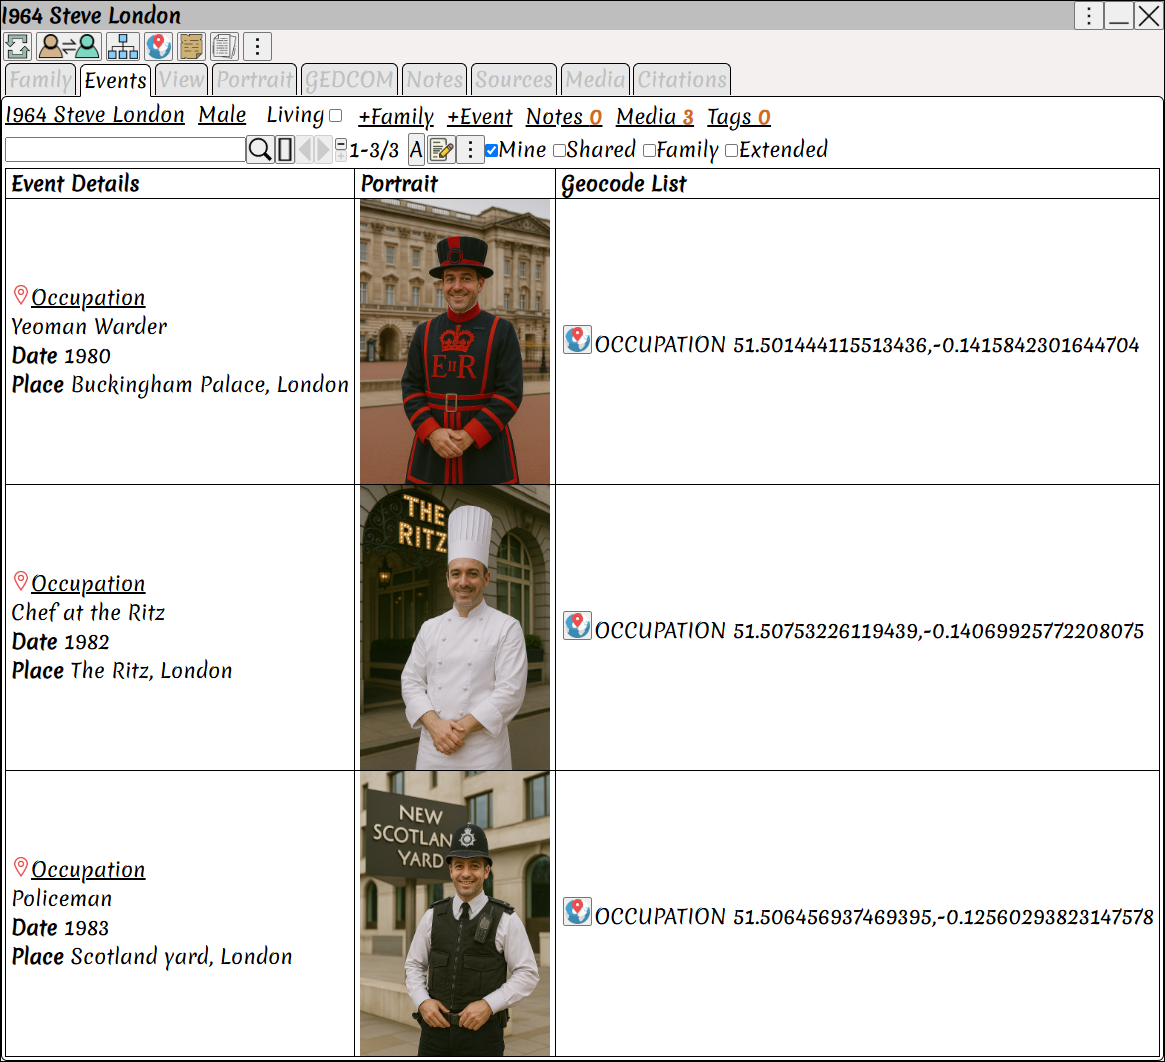
Let's follow the occupation of Steve London.
We have three geocoded events, see How to Geocode event
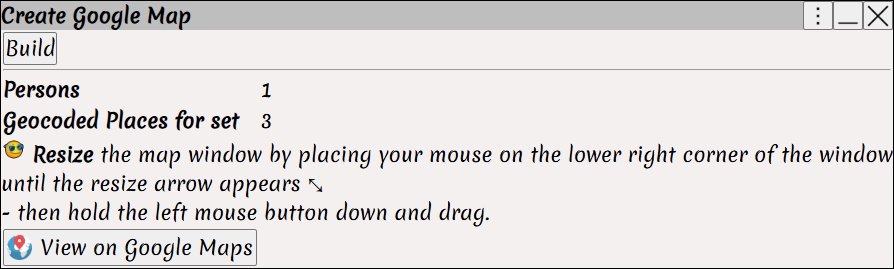
⟶ to generate the interactive map
We can see the location for each event, which is marked with a marker.
Click on the marker to view the event.
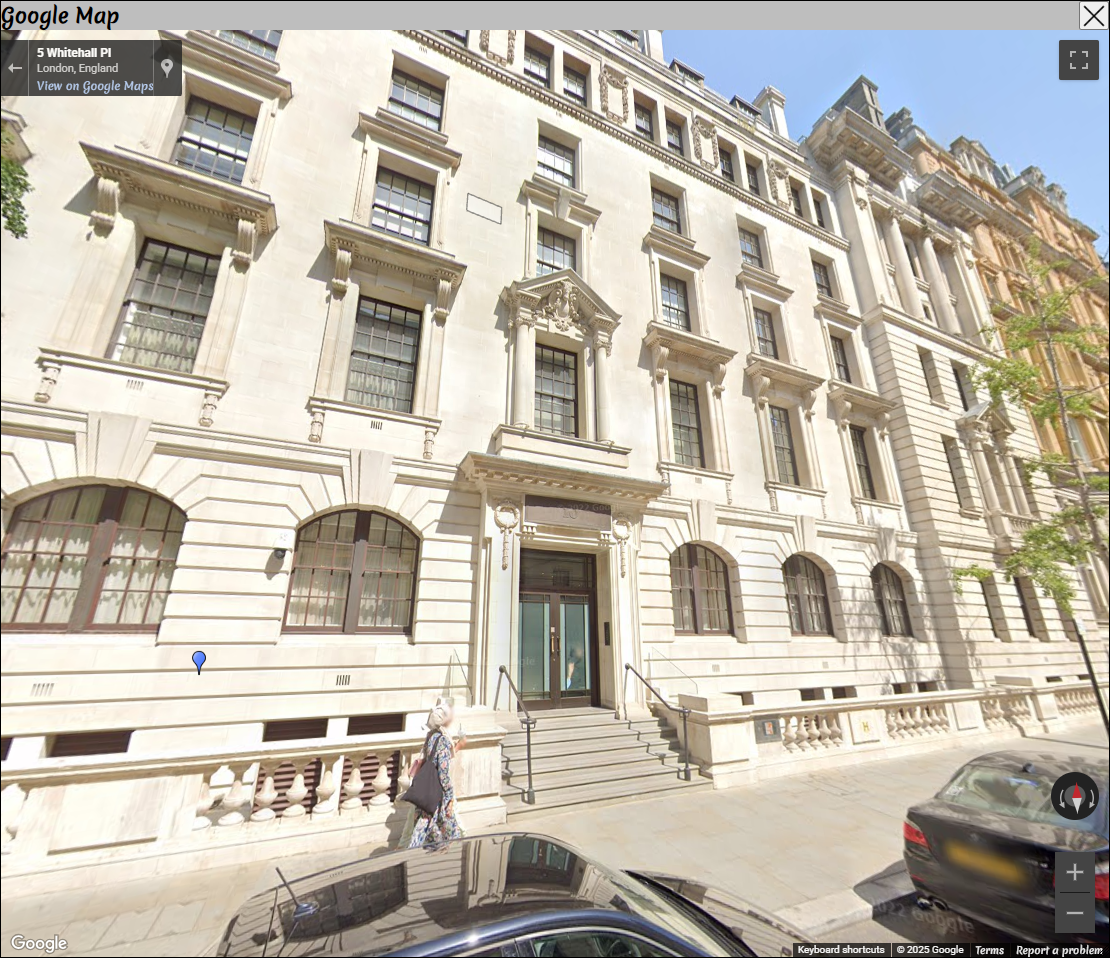
 Street view allows us to view the area around the event.